Use Cases
Real examples from production OpenClaw agent traces, queried with PuppyGraph (Cypher) and DuckDB (SQL).
Overview
Our test dataset: 6 days, 2,596 spans, 14 sessions, 14 tools, 3 models.
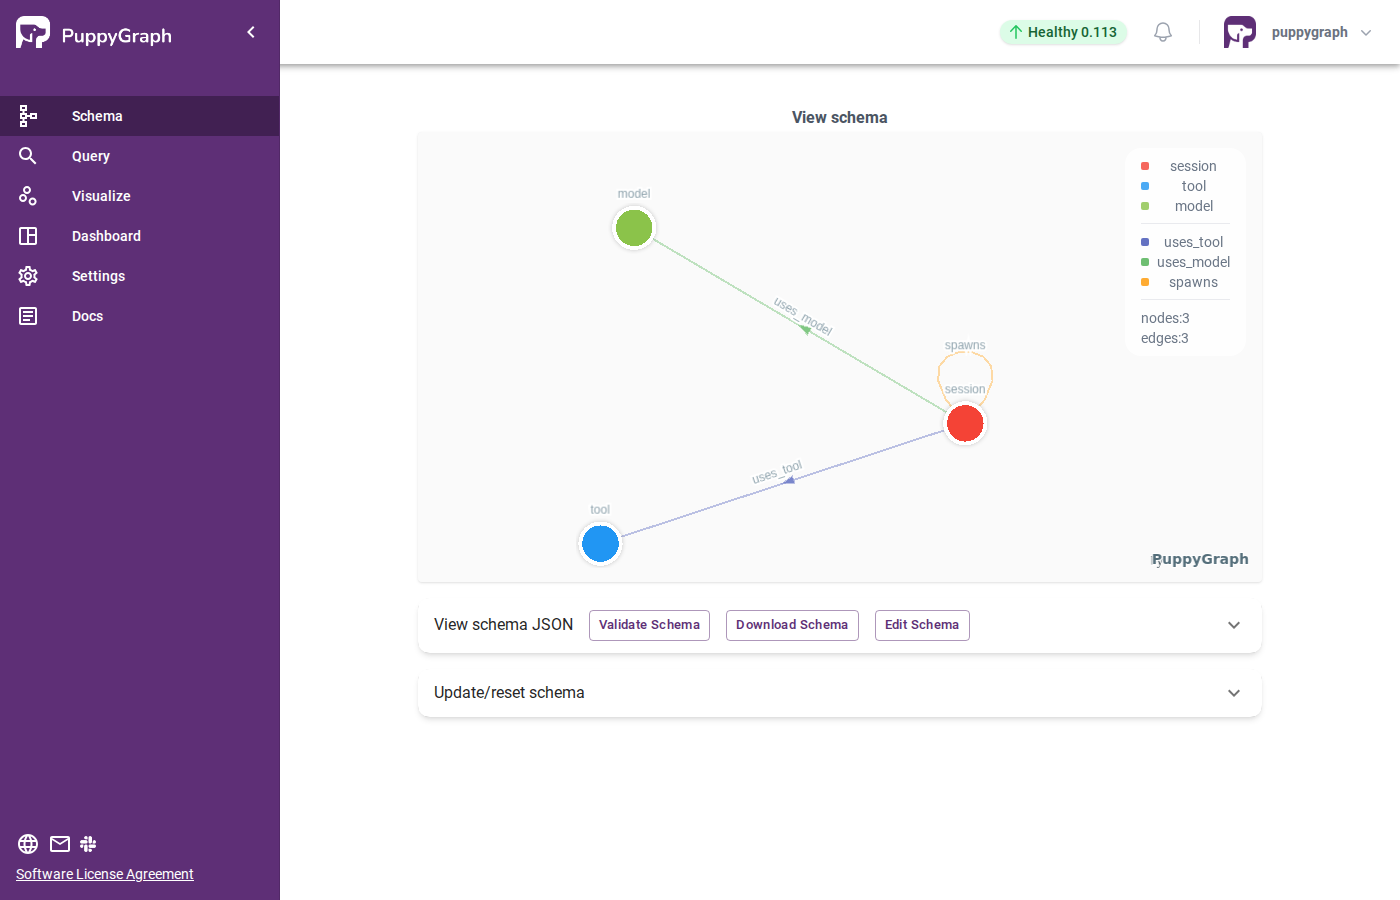
Graph: 31 vertices, 70 edges
├── 14 sessions (agents/subagents/cron)
├── 14 tools (exec, read, write, web_fetch...)
├── 3 models (claude-opus-4-6, claude-sonnet-4-6, stepfun)
├── 45 uses_tool edges
├── 19 uses_model edges
└── 6 spawns edges
The graph schema in PuppyGraph — session, tool, and model nodes with uses_tool, uses_model, and spawns edges:
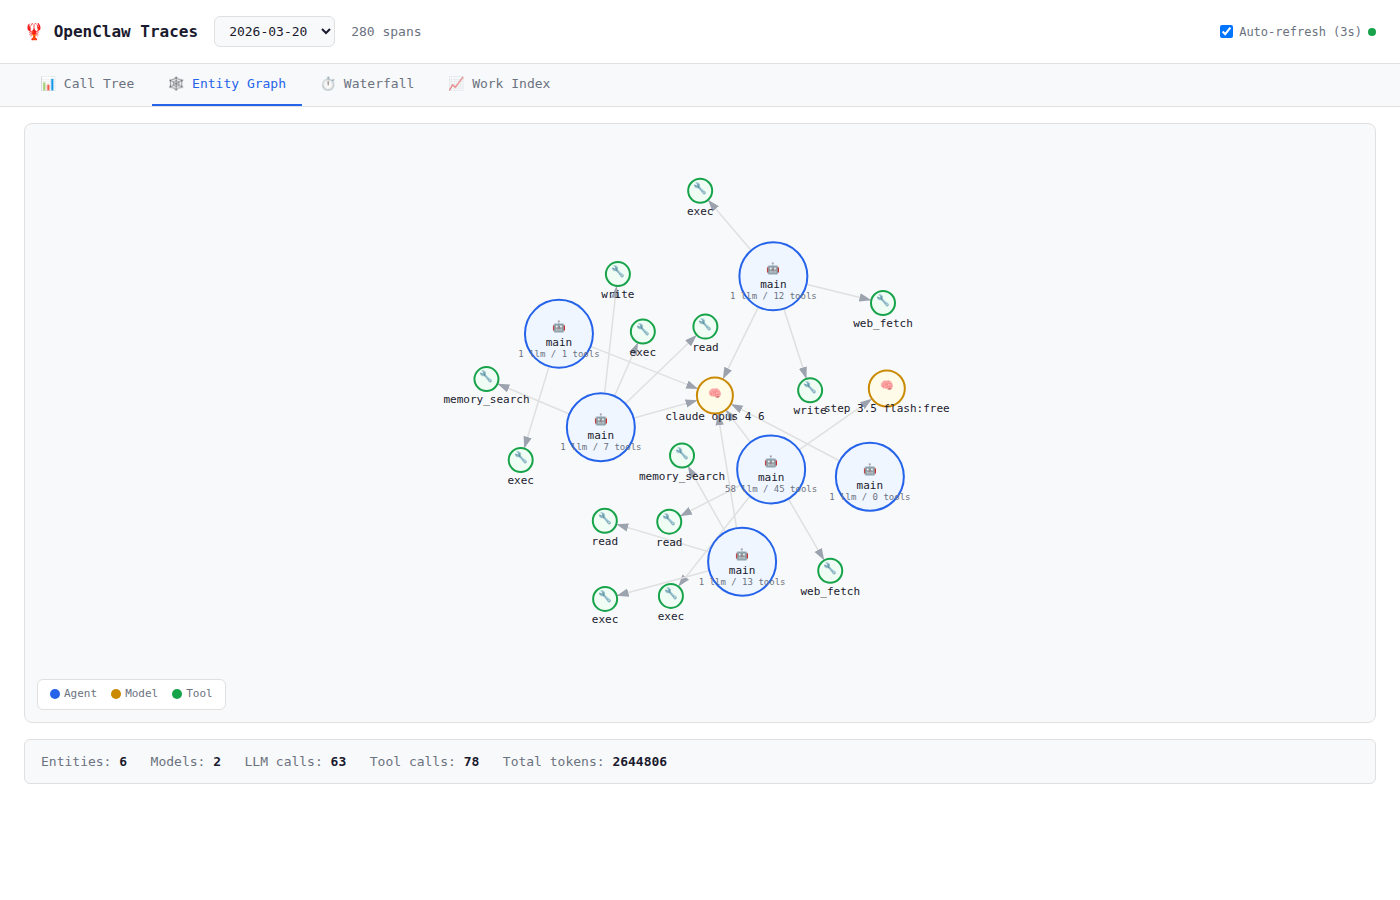
Here's how the Entity Graph looks in our Web UI — 6 agents, 2 models, tool nodes per entity:
1. Agent Tool Usage Profile
Question: What tools does each agent use most?
Cypher:
MATCH (s:session)-[u:uses_tool]->(t:tool)
RETURN s.agent_type, t.name, u.call_count
ORDER BY u.call_count DESC LIMIT 10
Result:
[main] → exec: 696 calls
[main] → web_fetch: 118 calls
[main] → write: 90 calls
[main] → read: 80 calls
[subagent] → read: 40 calls
[subagent] → read: 30 calls
Insight: Main agent heavily relies on exec (shell commands) — it's a doer. Subagents focus on read — they're researchers. This separation of concerns is a healthy agent pattern.
2. Subagent Delegation Chain
Question: What did the main agent delegate to subagents?
Cypher:
MATCH (p:session)-[:spawns]->(c:session)
RETURN p.session_key, c.session_key, c.tool_call_count, c.total_tokens_in
Result:
main → subagent:b9dae003  (tools=30, tokens=160,229)
main → subagent:0bdcc4a5  (tools=4, tokens=88,995)
main → subagent:06b0e0af  (tools=60, tokens=0)
main → subagent:1d8e216b  (tools=42, tokens=0)
main → subagent:d7639251  (tools=36, tokens=0)
main → cron:d7cbde0c      (tools=32, tokens=114,785)
Insight: 6 child entities spawned. Subagent 06b0e0af was the busiest (60 tool calls). Some show 0 tokens — they were spawned before the tracing plugin loaded, so llm_input hooks weren't captured. This is a useful debugging insight itself!
3. Model Cost Attribution
Question: Which models consume the most tokens, and who's using them?
Cypher:
MATCH (s:session)-[u:uses_model]->(m:model)
RETURN s.agent_type, m.name, sum(u.call_count) AS calls, sum(u.total_tokens_in) AS tokens
ORDER BY tokens DESC
Result:
main → claude-opus-4-6:         754 calls, 48,780,770 tokens
main → claude-sonnet-4-6:        21 calls,  3,065,408 tokens
main → stepfun/step-3.5-flash:   42 calls,  2,967,660 tokens
subagent → claude-opus-4-6:       7 calls,    249,224 tokens
Insight: Opus dominates at 48.8M tokens (89% of total). Sonnet handles 21 cheaper tasks. StepFun's free tier covers 42 calls at zero cost. Subagents are extremely token-efficient — only 249K tokens for 7 calls.
4. Tool Sharing Analysis
Question: Which tools are used across the most sessions?
Cypher:
MATCH (s:session)-[:uses_tool]->(t:tool)
RETURN t.name, count(s) AS used_by, t.avg_duration_ms
ORDER BY used_by DESC
Result:
exec:           12 sessions, avg 990ms
read:           11 sessions, avg  30ms
web_fetch:       5 sessions, avg 529ms
write:           5 sessions, avg  33ms
memory_search:   2 sessions, avg  68ms
browser:         1 session,  avg 1175ms
Insight: exec and read are universal (used by 85% of sessions). browser is the slowest (1.2s) but rarely needed. read at 30ms avg is 33x faster than exec at 990ms — prefer read over exec cat for file access.
5. Subagent Tool Chains (2-hop Query)
Question: What tools do subagents use after being spawned by the main agent?
This is where graph queries shine — a 2-hop traversal that would be complex in SQL:
Cypher:
MATCH (main:session)-[:spawns]->(sub:session)-[u:uses_tool]->(t:tool)
RETURN sub.session_key, t.name, u.call_count
ORDER BY u.call_count DESC LIMIT 10
Result:
subagent:06b0e0af → read:  40 calls
subagent:1d8e216b → read:  30 calls
subagent:d7639251 → read:  28 calls
subagent:b9dae003 → exec:  20 calls
subagent:06b0e0af → exec:  20 calls
cron:d7cbde0c     → exec:  18 calls
cron:d7cbde0c     → read:  12 calls
Insight: Subagents are primarily readers (read:98 vs exec:68). The cron job mixes both. This pattern confirms subagents are used for research/exploration while the main agent executes decisions.
6. Tool Co-occurrence
Question: Which tools tend to be used together in the same session?
Cypher:
MATCH (s:session)-[:uses_tool]->(t1:tool), (s)-[:uses_tool]->(t2:tool)
WHERE t1.name < t2.name
RETURN t1.name, t2.name, count(s) AS co_occurrence
ORDER BY co_occurrence DESC LIMIT 8
Result:
exec + read:              10 sessions (71%)
exec + write:              5 sessions (36%)
read + write:              5 sessions (36%)
read + web_fetch:          5 sessions (36%)
exec + web_fetch:          4 sessions (29%)
web_fetch + write:         3 sessions (21%)
memory_search + web_fetch: 2 sessions (14%)
memory_search + read:      2 sessions (14%)
Insight: exec + read is the dominant pattern — nearly every session uses both. web_fetch often pairs with read and write, suggesting a fetch → read → write pipeline. memory_search only appears with research tools, confirming it's part of the exploration workflow.
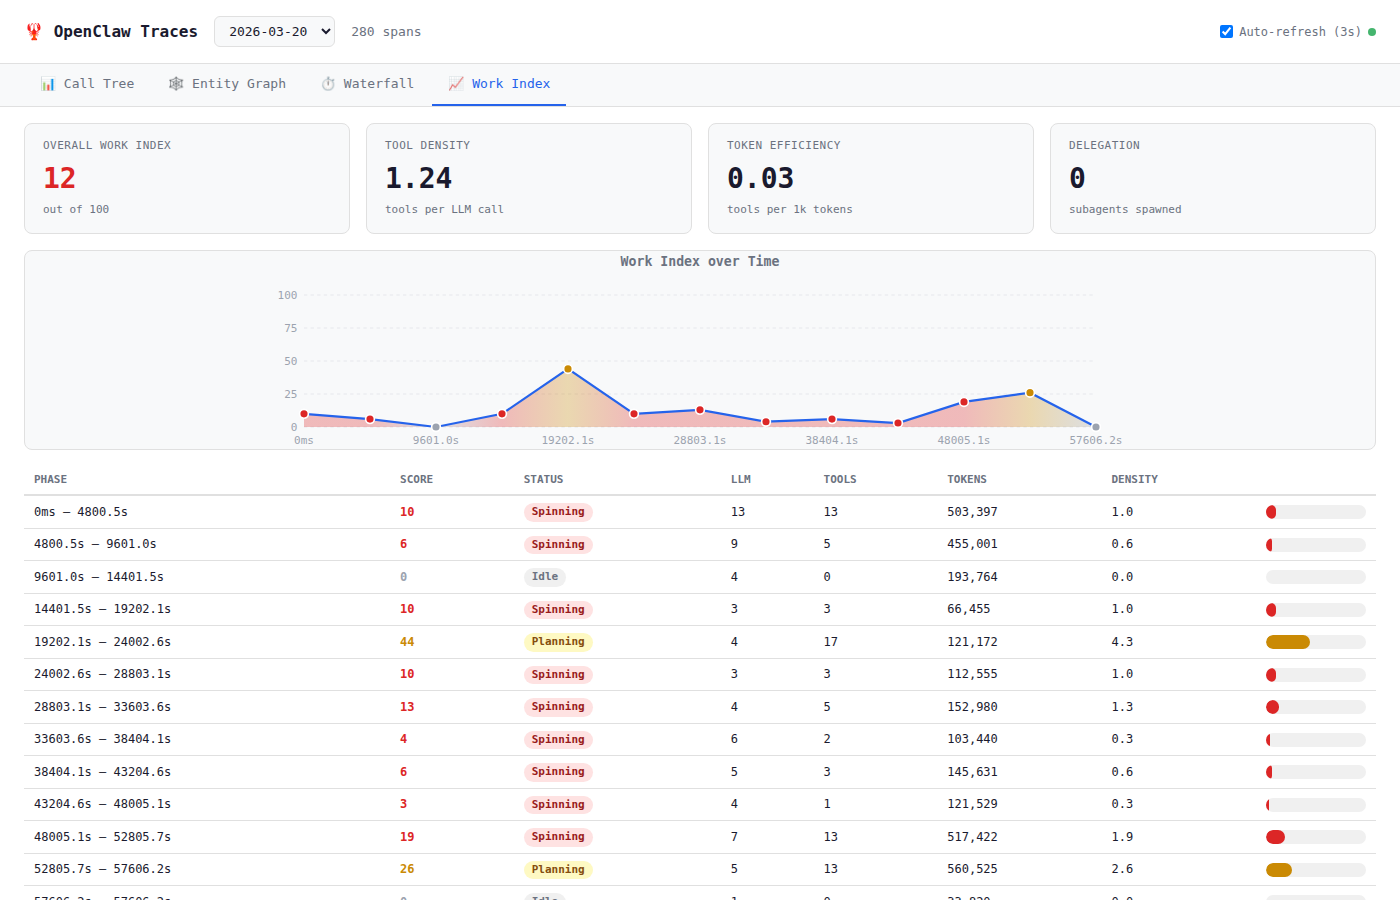
7. Spinning Detection
Question: Are any agents burning tokens without doing real work?
Here the Work Index view from our Web UI is very useful:
SQL (DuckDB):
SELECT session_key,
       COUNT(*) FILTER (WHERE kind='llm_call') as llm,
       COUNT(*) FILTER (WHERE kind='tool_call') as tools,
       COALESCE(SUM(tokens_in), 0) as tokens,
       ROUND(COUNT(*) FILTER (WHERE kind='tool_call')::FLOAT /
             NULLIF(COUNT(*) FILTER (WHERE kind='llm_call'), 0), 1) as density
FROM spans
GROUP BY session_key
ORDER BY tokens DESC
Result:
session_key                              | llm | tools | tokens    | density
agent:main:main                          | 99  | 171   | 9,013,761 | 1.7
agent:main:subagent:b9dae003             |  2  |  30   |   160,229 | 15.0
agent:main:cron:4945510b                 |  2  |   2   |    35,342 | 1.0
Insight:
- Main agent density 1.7 = Planning/Working boundary. Could be more efficient.
- Subagent b9dae003 density 15.0 = extremely efficient! 30 tools with only 2 LLM calls. This is the ideal agent pattern.
- Cron job density 1.0 = borderline spinning with equal LLM and tool calls.
8. Daily Token Trend
Question: How does agent usage vary across days?
The Call Tree view shows individual day traces:

SQL (DuckDB):
SELECT CAST(epoch_ms(start_ms) AS DATE) as day,
       COUNT(*) FILTER (WHERE kind='llm_call') as llm,
       COUNT(*) FILTER (WHERE kind='tool_call') as tools,
       COALESCE(SUM(tokens_in), 0) as tokens
FROM spans GROUP BY day ORDER BY day
Result:
day        | llm | tools | tokens     | density
2026-03-12 | 106 | 341   |  9,209,332 | 3.2
2026-03-13 | 166 | 259   |  8,191,351 | 1.6
2026-03-14 | 128 | 182   |  5,208,367 | 1.4
2026-03-15 | 162 | 426   | 19,235,430 | 2.6 ← busiest
2026-03-16 | 170 | 395   | 10,484,519 | 2.3
2026-03-17 |  88 | 132   |  2,674,099 | 1.5
Insight: March 15 was the busiest day (19.2M tokens, 426 tool calls, density 2.6). March 12 had the highest density (3.2) — most efficient day. March 13-14 were lower density, suggesting more planning/thinking days. Token consumption doesn't always correlate with productivity.
Summary
| Use Case | Best Tool | Key Finding |
|---|---|---|
| Tool usage profile | PuppyGraph | Main agent = doer (exec), subagents = researchers (read) |
| Delegation chain | PuppyGraph | 6 child entities, subagent 06b0e0af busiest at 60 tools |
| Cost attribution | PuppyGraph | Opus = 89% of tokens, subagents are 200x cheaper |
| Tool sharing | PuppyGraph | exec + read universal (85% of sessions) |
| 2-hop tool chains | PuppyGraph | Subagents do 60% read, main does 60% exec |
| Co-occurrence | PuppyGraph | exec+read is the #1 pattern (71% of sessions) |
| Spinning detection | DuckDB + Web UI | Subagent b9dae003 density 15.0 = most efficient |
| Daily trends | DuckDB + Web UI | March 15 busiest, March 12 most efficient |
Want to try these queries yourself?
Set up PuppyGraph with the integration guide, or use openclaw traces:query for SQL queries without any extra infrastructure.