Web UI
Open http://<your-gateway>/plugins/tracing in a browser. The UI has four tabs:
Call Tree
Nested span hierarchy showing the full execution flow.

- Consecutive same-tool calls auto-collapse (e.g.
llm ×11,read ×2) - Click collapsed groups to expand
- New spans highlight green on auto-refresh
- Shows tool parameters, duration, and token usage
Entity Graph
Force-directed SVG visualization showing relationships between agents, tools, and models.
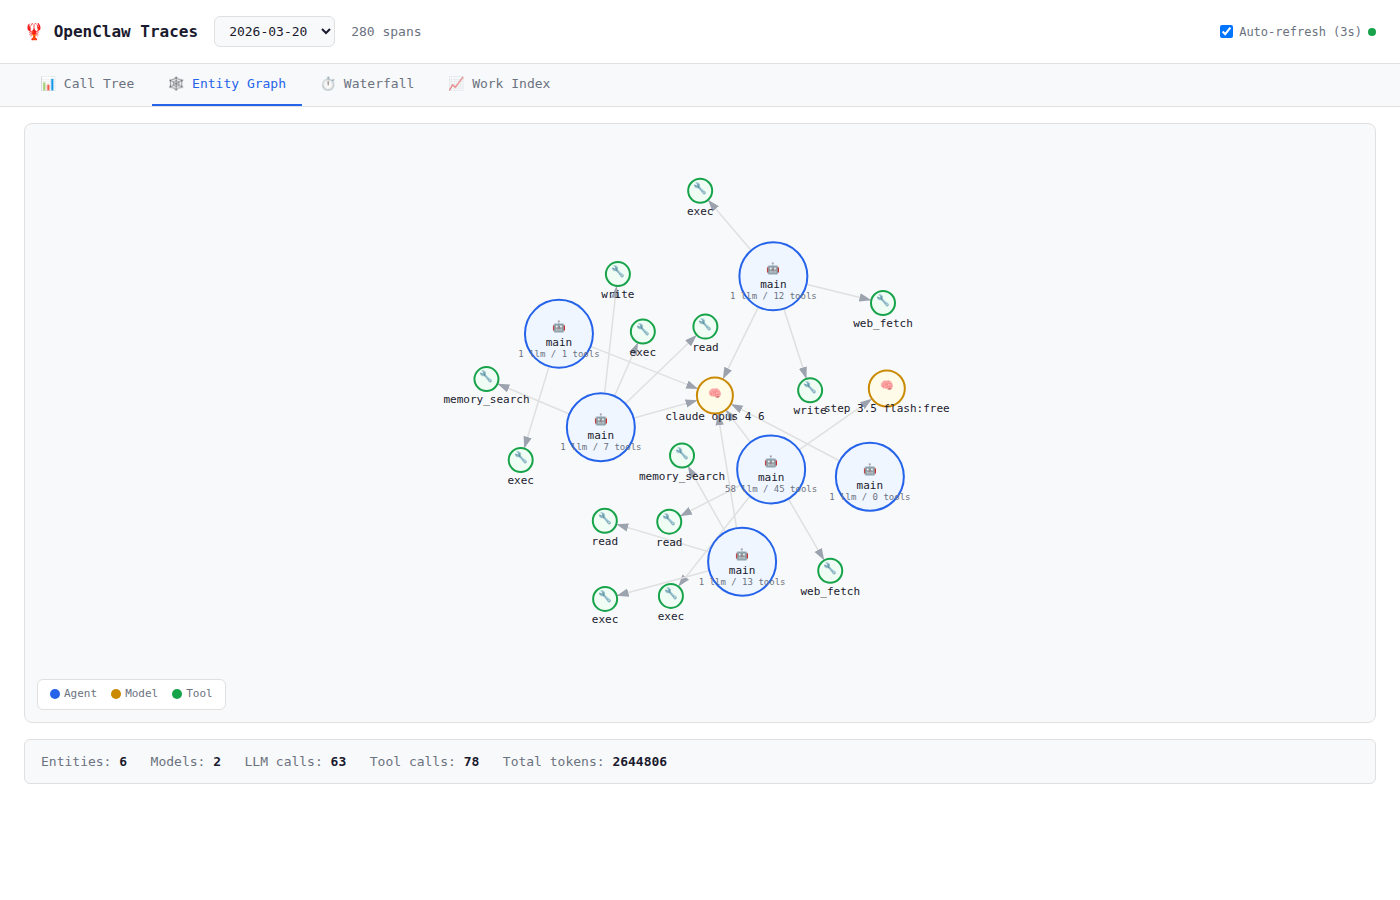
- Agent nodes (blue) — main agents and subagents
- Tool nodes (green) — per-entity tool usage
- Model nodes (yellow) — shared across entities
- Spawn edges (blue dashed) — parent→child relationships
Drag nodes to rearrange. Hover for detailed tooltips.
Waterfall
Timeline bar chart showing all spans with their start time and duration.
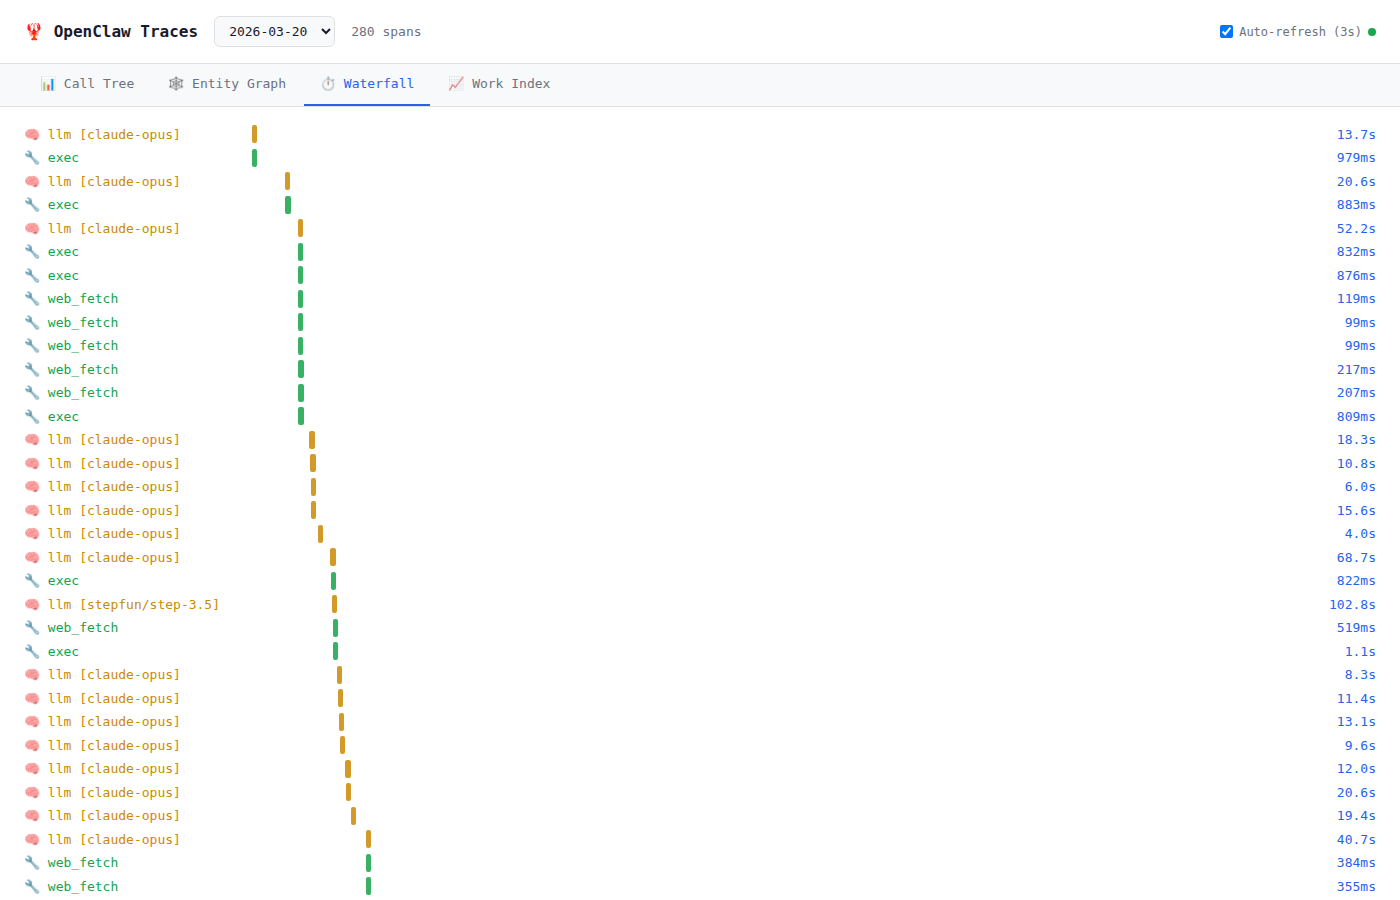
Useful for identifying bottlenecks and parallelism.
Work Index
Agent productivity scoring per time window with time-series chart and phase breakdown.
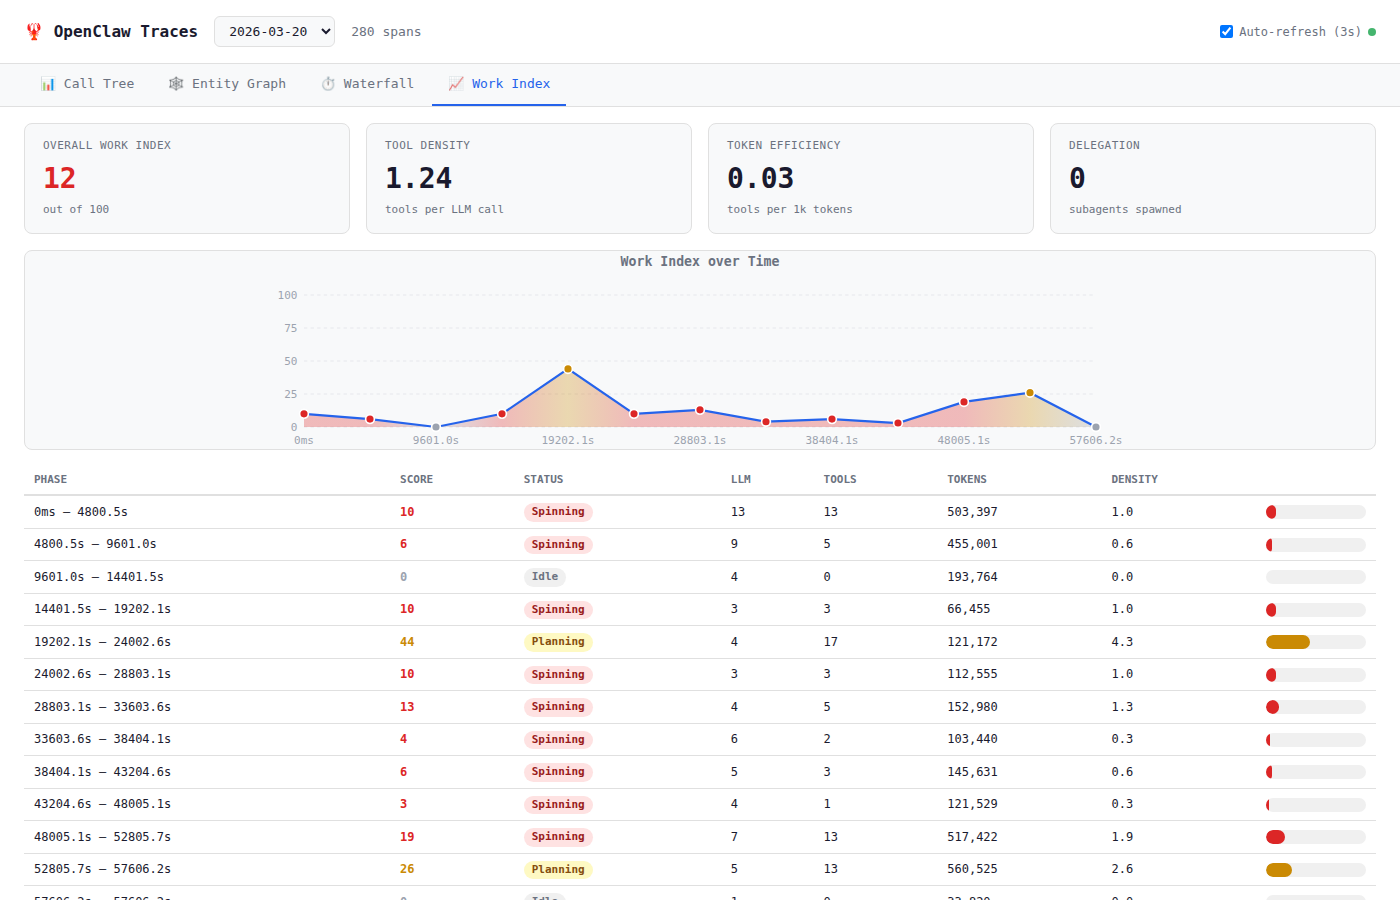
See Work Index for the scoring formula and interpretation.
Auto-refresh
The UI polls every 3 seconds for new data. Toggle with the checkbox in the header. New spans appear with a green highlight animation that fades after 5 seconds.